Analytics
Metrics and analytics
Edge DNS provides detailed metrics on query volume, response times and traffic patterns to help you understand how your domains are being used.
On this page7 sections
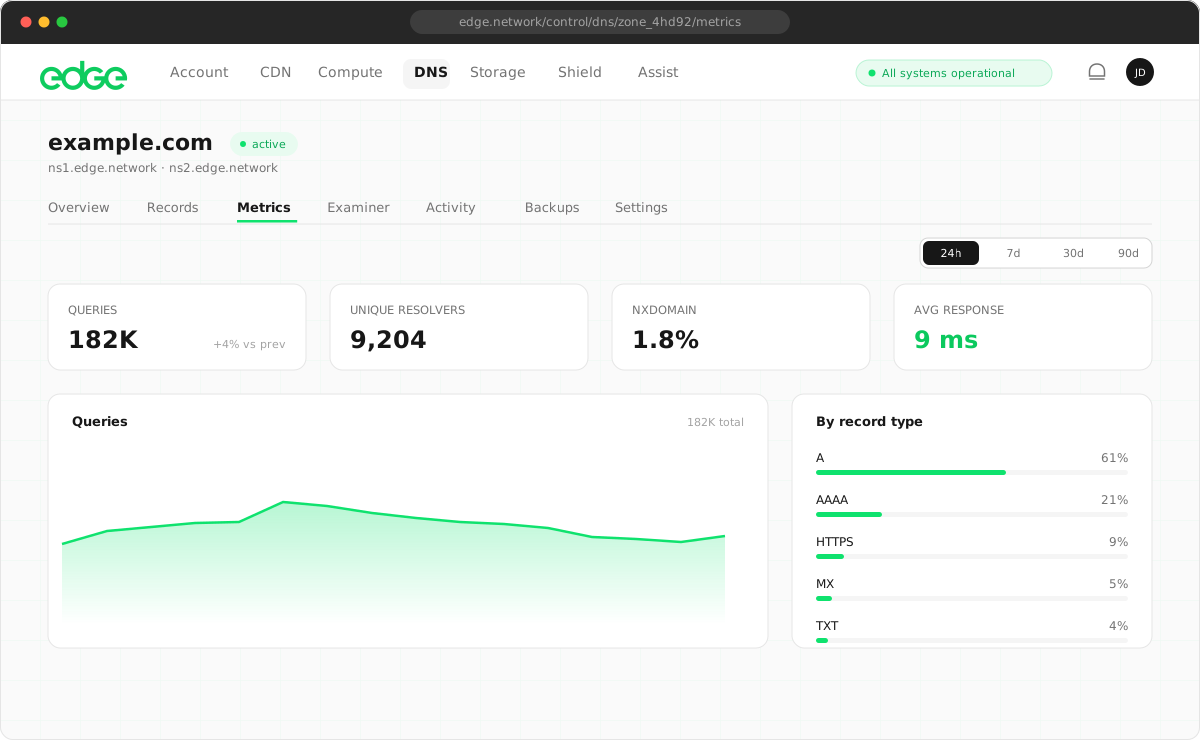
Available metrics#
- Query count: total number of DNS queries received for your zone, broken down by time period.
- Latency: average and maximum response times in microseconds. Typical resolution is under 10ms.
- Query types: breakdown by record type (A, AAAA, MX, TXT, etc.) to understand query patterns.
- Response codes: distribution of response types, such as
NOERROR,NXDOMAINandREFUSED. - Geographic distribution: query volume by country, based on resolver location (GeoIP).
- Node distribution: which Edge nodes handled your queries, showing traffic distribution.
Time ranges#
View metrics at different granularities depending on your analysis needs:
| Range | Granularity | Data points |
|---|---|---|
| Last hour | 1 minute | ~60 points |
| Last 24 hours | 1 minute | ~1,440 points |
| Last 7 days | 1 hour | ~168 points |
| Last 30 days | 1 day | ~30 points |
Data retention#
Metrics are automatically aggregated and pruned to optimise storage while keeping useful historical data:
| Granularity | Data | Retention |
|---|---|---|
1m |
Minute-level data | 24 hours |
1h |
Hourly aggregates | 7 days |
1d |
Daily aggregates | 90 days |
Viewing metrics#
- Navigate to your zone. Go to DNS and select your domain.
- Click the Metrics tab. View charts and statistics for your zone.
- Select a time range. Choose 1h, 24h, 7d or 30d to adjust the view.
API access#
Fetch metrics programmatically for custom dashboards or monitoring.
Get zone metrics#
HTTP
GET /api/dns/zones/:id/metrics?range=24hResponse:
JSON
{
  "metrics": {
    "zone": "example.com",
    "from": "2024-01-14T00:00:00Z",
    "to": "2024-01-15T00:00:00Z",
    "granularity": "1m",
    "data": [
      {
        "timestamp": "2024-01-14T00:00:00Z",
        "queryCount": 1234,
        "byType": { "A": 800, "AAAA": 300, "MX": 134 },
        "byResponse": { "NoError": 1200, "NXDomain": 34 },
        "byCountry": { "US": 500, "GB": 300, "DE": 200 },
        "latencyAvgUs": 2500,
        "latencyMaxUs": 15000
      }
    ]
  }
}
Get account-wide DNS stats#
HTTP
GET /api/dns/statsResponse:
JSON
{
  "stats": {
    "totalQueries": 1234567,
    "avgLatencyMs": 8,
    "zoneCount": 5,
    "recordCount": 47
  }
}
Common use cases#
- Traffic monitoring: track query volume over time to understand traffic patterns and identify unexpected spikes that might indicate issues or attacks.
- Performance analysis: monitor latency metrics to ensure DNS resolution stays fast. Investigate whether max latency spikes occur during high-traffic periods.
- Error detection: watch the response code distribution. High
NXDOMAINrates might indicate misconfigurations or broken links pointing to non-existent subdomains. - Geographic insights: see where your users are located based on query origins. Useful for planning geo routing or understanding your audience.
Next steps
Something unclear or out of date? Tell us