Analytics
CDN analytics
Get insights into your CDN traffic, cache performance and bandwidth usage.
On this page11 sections
Analytics dashboard#
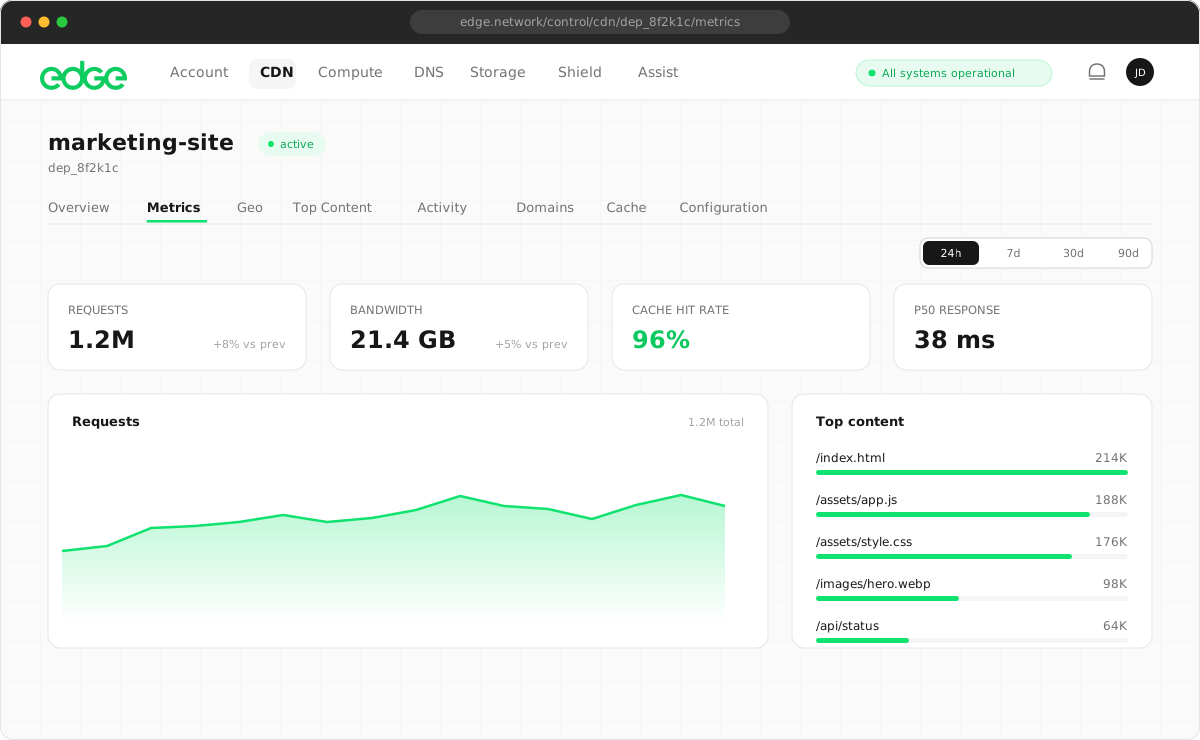
Each CDN deployment includes a real-time analytics dashboard showing key performance metrics.
Key metrics#
- Total requests: the total number of HTTP requests served by the CDN across all domains in the deployment.
- Cache hits: requests served directly from the edge cache without contacting your origin server.
- Cache misses: requests that required fetching content from your origin server.
- Bandwidth: total data transferred from the CDN to end users.
Cache hit rate#
Your cache hit rate is one of the most important CDN metrics. It shows what percentage of requests are being served from cache vs. fetched from origin. For example, 8,730 cache hits and 1,270 cache misses give a cache hit rate of 87.3%.
| Hit rate | Rating |
|---|---|
| <50% | Needs optimisation |
| 50–80% | Good |
| >80% | Excellent |
Time ranges#
View analytics across different time periods:
- Last 24 hours
- Last 7 days
- Last 30 days
Per-domain analytics#
Click any domain in your deployment to see its individual analytics. For example:
| Domain | Requests |
|---|---|
cdn.yoursite.com |
12.5K |
assets.yoursite.com |
8.2K |
images.yoursite.com |
3.1K |
Top content#
Identify your most requested content with the Top Content tab. This feature tracks the most popular paths across your CDN deployment in real time.
Metrics per path#
- Request count
- Bandwidth served
- Cache hits
- Cache misses
An example of the Top Content view:
| # | Path | Requests | Bandwidth | Hit rate |
|---|---|---|---|---|
| 1 | /assets/logo.png |
15.4K | 147 MB | 98% |
| 2 | /images/hero.jpg |
8.7K | 437 MB | 97% |
| 3 | /api/products |
3.2K | 12 MB | 45% |
Use cases#
- Popular content: identify which assets drive the most traffic to optimise their delivery.
- Cache optimisation: find paths with low hit rates that may benefit from configuration changes.
- Bandwidth hotspots: see which content consumes the most bandwidth for cost analysis.
Traffic visualisation#
View your traffic patterns over time with interactive charts:
- Requests over time: see request volume trends and identify peak traffic periods.
- Cache performance: compare cache hits vs misses over time to monitor caching effectiveness.
- Bandwidth usage: track data transfer volumes and plan for capacity.
Data retention#
Analytics data is stored with the following retention periods:
| Data | Retention |
|---|---|
| Minute-level data | 24 hours |
| Hourly aggregates | 7 days |
| Daily aggregates | 30 days |
| Monthly aggregates | 12 months |
Improving cache performance#
If your cache hit rate is lower than expected, try these optimisations:
- Increase
Cache-Controlmax-age. Longer TTLs mean content stays cached longer. Use versioned URLs for assets that change. - Normalise query strings. Avoid unnecessary query parameters that create different cache keys for the same content.
- Remove
Set-Cookiefrom static assets. Responses withSet-Cookieheaders aren’t cached. Ensure your origin doesn’t set cookies on static files.
Activity log#
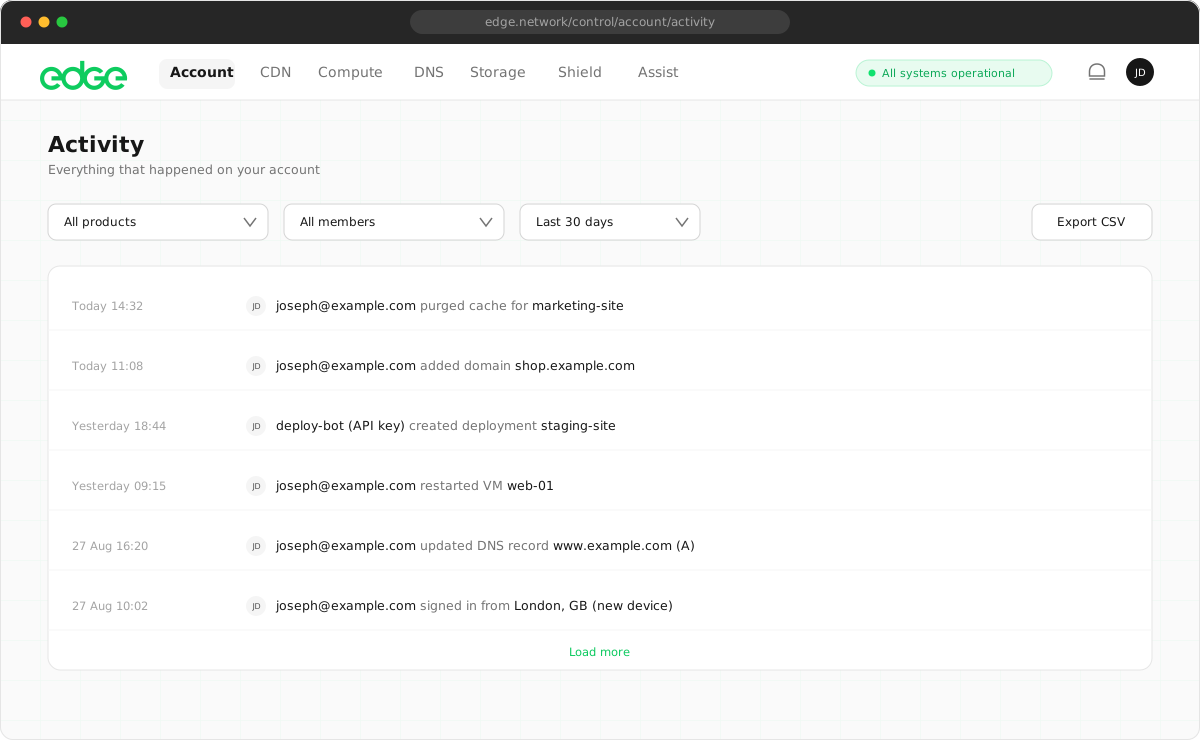
Every CDN deployment includes an activity log that records all changes and events. Access it from the Activity tab in your deployment dashboard.
What’s logged#
- Deployment created/deleted
- Domains added/removed
- Configuration changes
- Cache purge operations
- DNS verification status
- SSL certificate issuance
Each event has a status:
- Completed: the action completed successfully
- Pending: the action is in progress
- Failed: the action encountered an error
Next steps
Something unclear or out of date? Tell us