Observability
Monitoring
Track your VM's performance with built-in metrics and graphs.
On this page10 sections
Overview#
Edge Network provides built-in monitoring for all VMs at no additional cost. View real-time and historical metrics for CPU, memory, disk and network to understand your VM’s performance.
Accessing metrics#
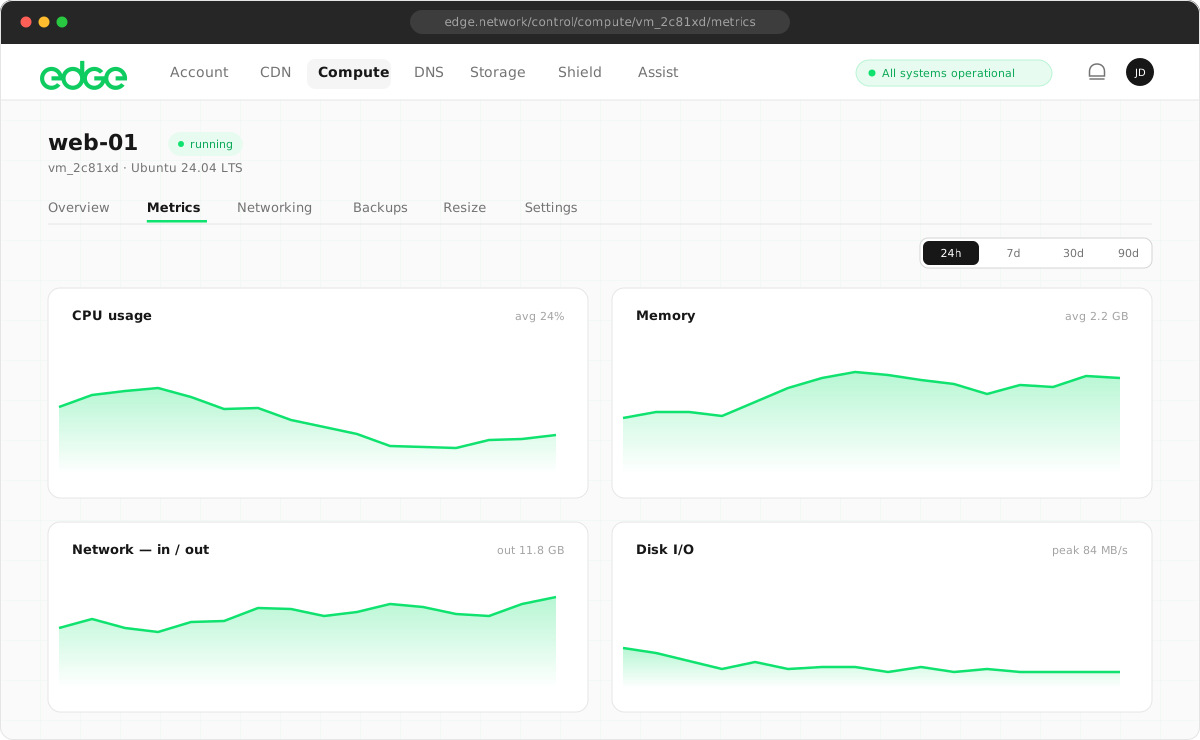
View your VM’s metrics from the Metrics tab in the VM dashboard.
- Navigate to your VM in the console.
- Click the Metrics tab.
- Select a time range (1 hour, 6 hours, 24 hours, 7 days or 30 days).
CPU metrics#
Monitor CPU utilisation to understand your VM’s processing load.
CPU usage (%)#
The percentage of CPU capacity being used, averaged across all vCPUs.
- 0–60%: normal operation
- 60–85%: increased load, monitor closely
- 85–100%: high load, consider upgrading
Memory metrics#
Track RAM usage to ensure your applications have enough memory.
Memory usage#
- Used: RAM actively in use by processes
- Cached: RAM used for disk caching (can be freed)
- Available: RAM available for new processes
- Total: total RAM allocated to your VM
Disk metrics#
Monitor disk usage and I/O performance.
- Disk usage: percentage of disk space used. Keep it below 90% to avoid performance issues.
- Disk I/O (read/write): data transfer rate to and from disk, measured in MB/s or IOPS.
- Disk latency: time for disk operations to complete. Lower is better (<10ms is excellent).
Network metrics#
Track network traffic to and from your VM.
- Network in: data received by your VM (inbound traffic), measured in Mbps.
- Network out: data sent from your VM (outbound traffic), measured in Mbps.
- Packets: number of network packets transmitted and received.
Time ranges#
Select different time ranges to view historical data:
| Range | Resolution | Use case |
|---|---|---|
| 1 hour | 1 minute | Real-time debugging |
| 6 hours | 5 minutes | Recent activity |
| 24 hours | 15 minutes | Daily patterns |
| 7 days | 1 hour | Weekly trends |
| 30 days | 4 hours | Monthly overview |
Quick stats#
The VM Overview page shows current resource usage at a glance.
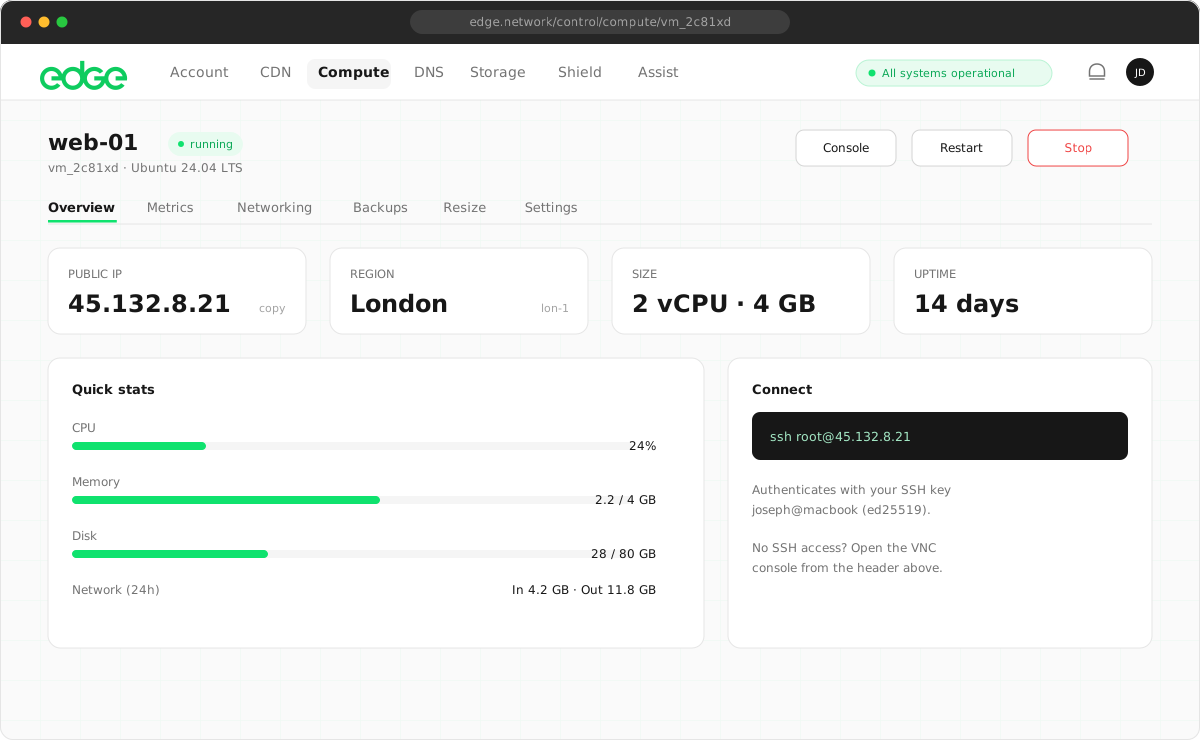
These metrics update automatically and show your VM’s current state.
Monitoring best practices#
- Check metrics regularly: review your metrics at least weekly to catch trends before they become problems.
- Understand your baseline: know what “normal” looks like for your application so you can spot anomalies.
- Scale before you need to: if resources are consistently at 70–80% utilisation, consider upgrading before issues occur.
- Correlate metrics: high CPU with normal memory often means a CPU-bound workload. High memory with CPU spikes may indicate memory pressure.
Coming soon#
- Alerts: get notified when metrics exceed thresholds
- Export: download metrics data as CSV
- Integrations: send metrics to external monitoring tools
Something unclear or out of date? Tell us